Project
About EasyGSH-DB
Structur and work packages
Goals
Projectpartner
Maps
Overview
Map for analysis data
Map for synoptic hydrodynamic
Download
Overview
Geomorphology
Sedimentology
Hydrodynamic
Synoptic Hydrodynamic
Prototype products
Information portal
Publications
Workshops
Closing event
Poster and Newsletter
Validation document
Annual data sheets
How-to-cite
Metadata
Gallery
close ×
About EasyGSH-DB
Maps
Download
Information portal
Publications
Gallery
Gallery
20
Years
900+
Data
20
Annual data sheets
5
Projectpartner
Kein alternativer Inhalt für Skripte

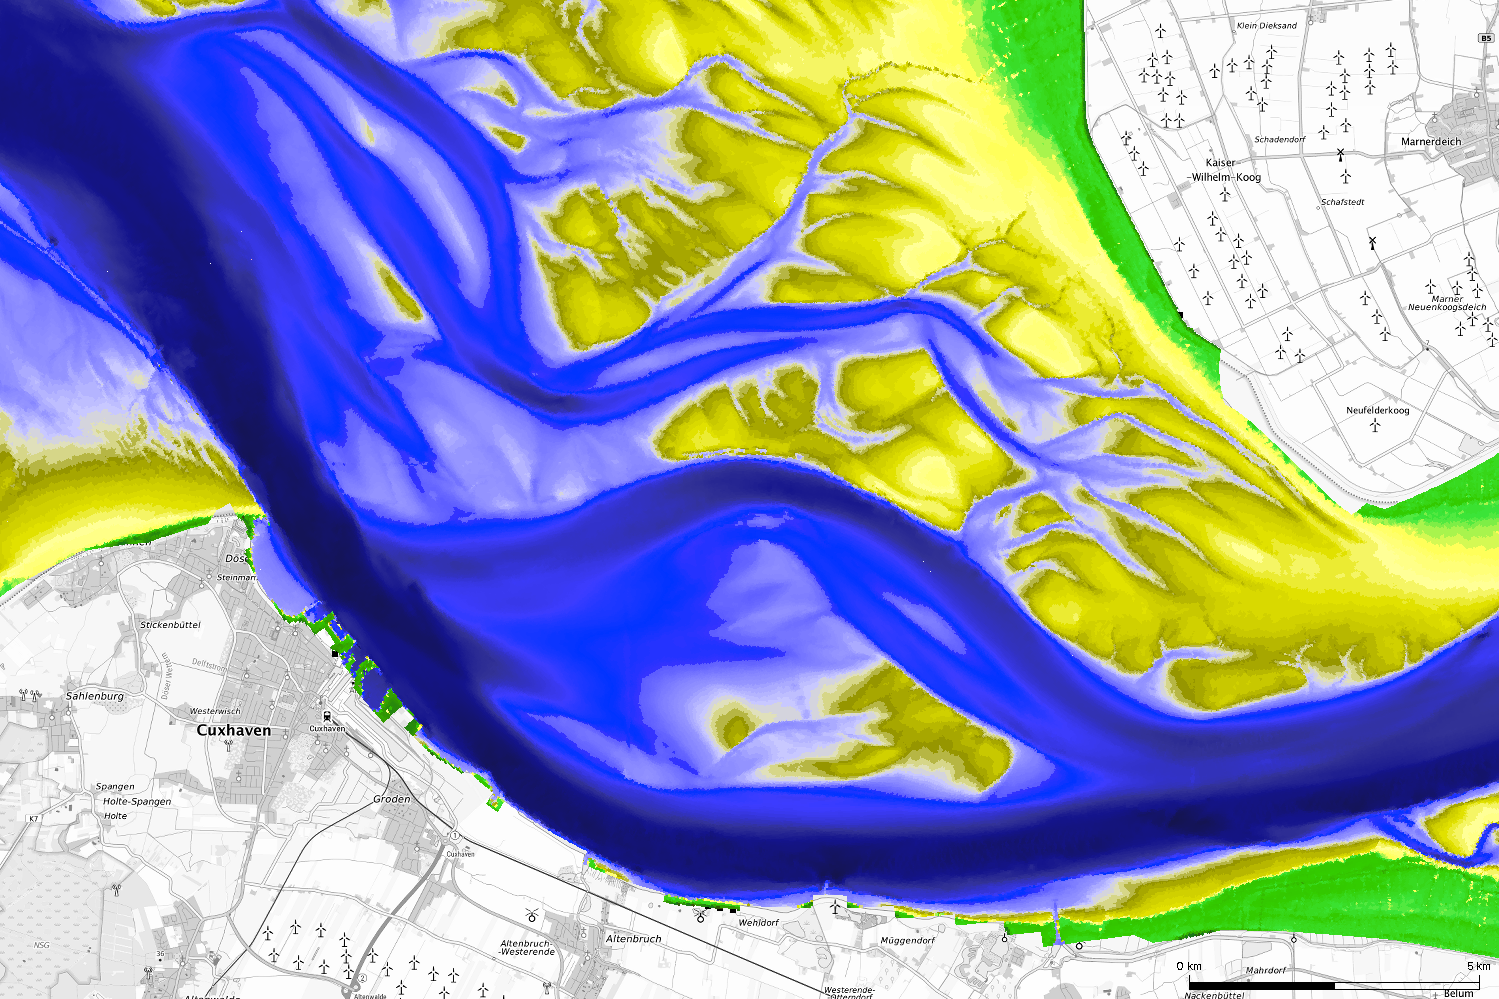
![Animation: tidal low water [m] from 1996 until 2015](assets/Bilder/Webseite/Galerie/50_Tnw1996_2015.gif)
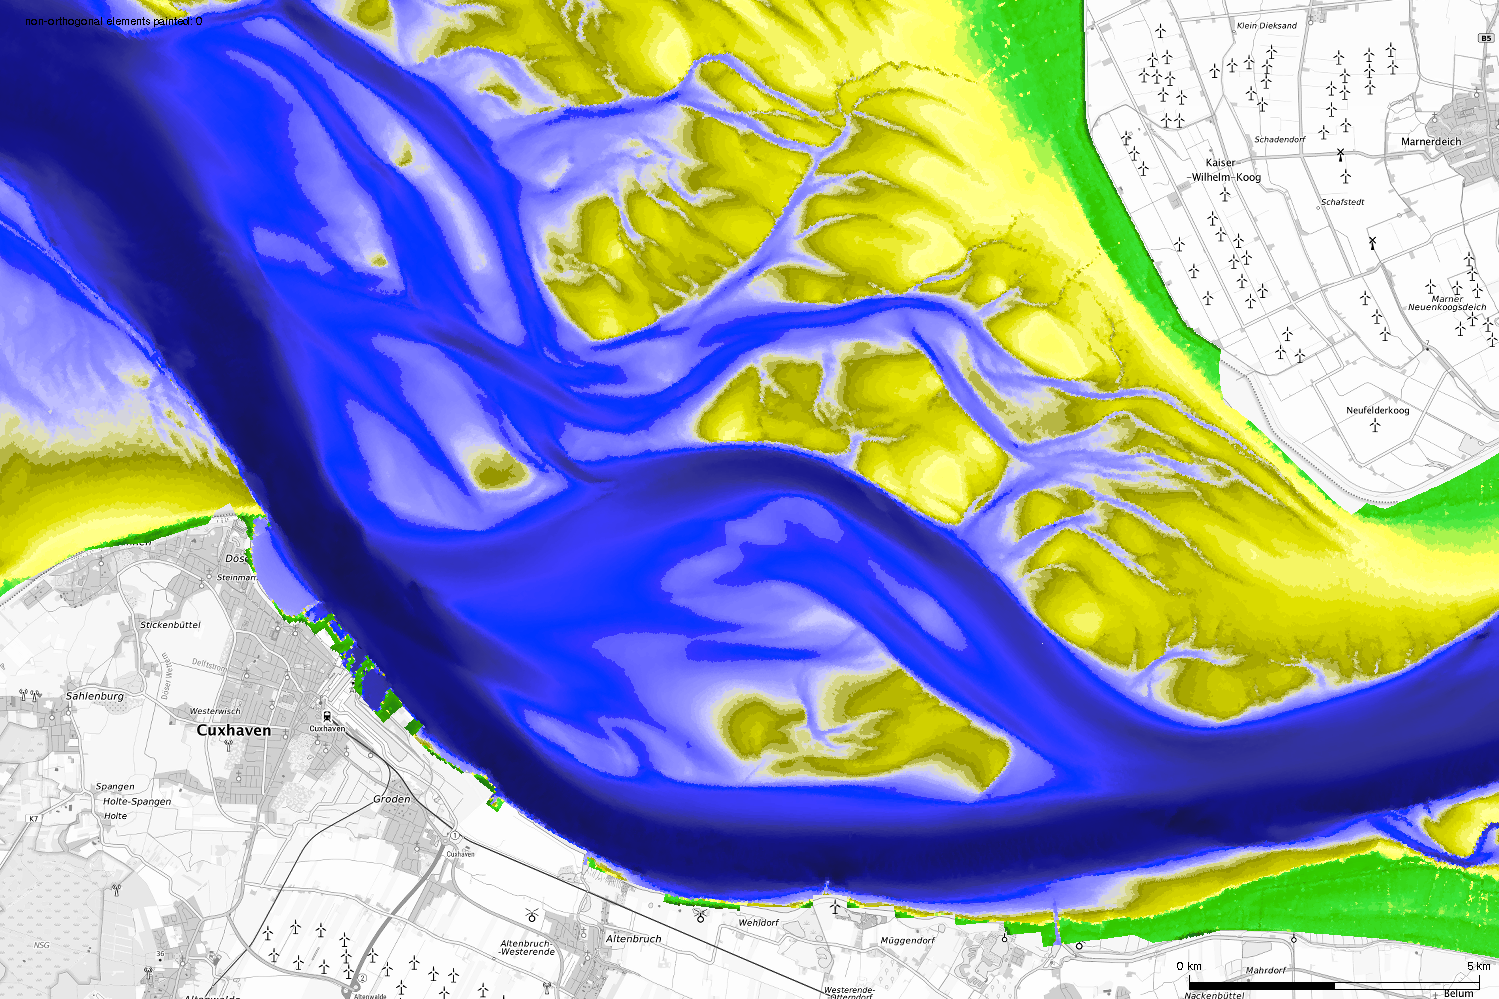
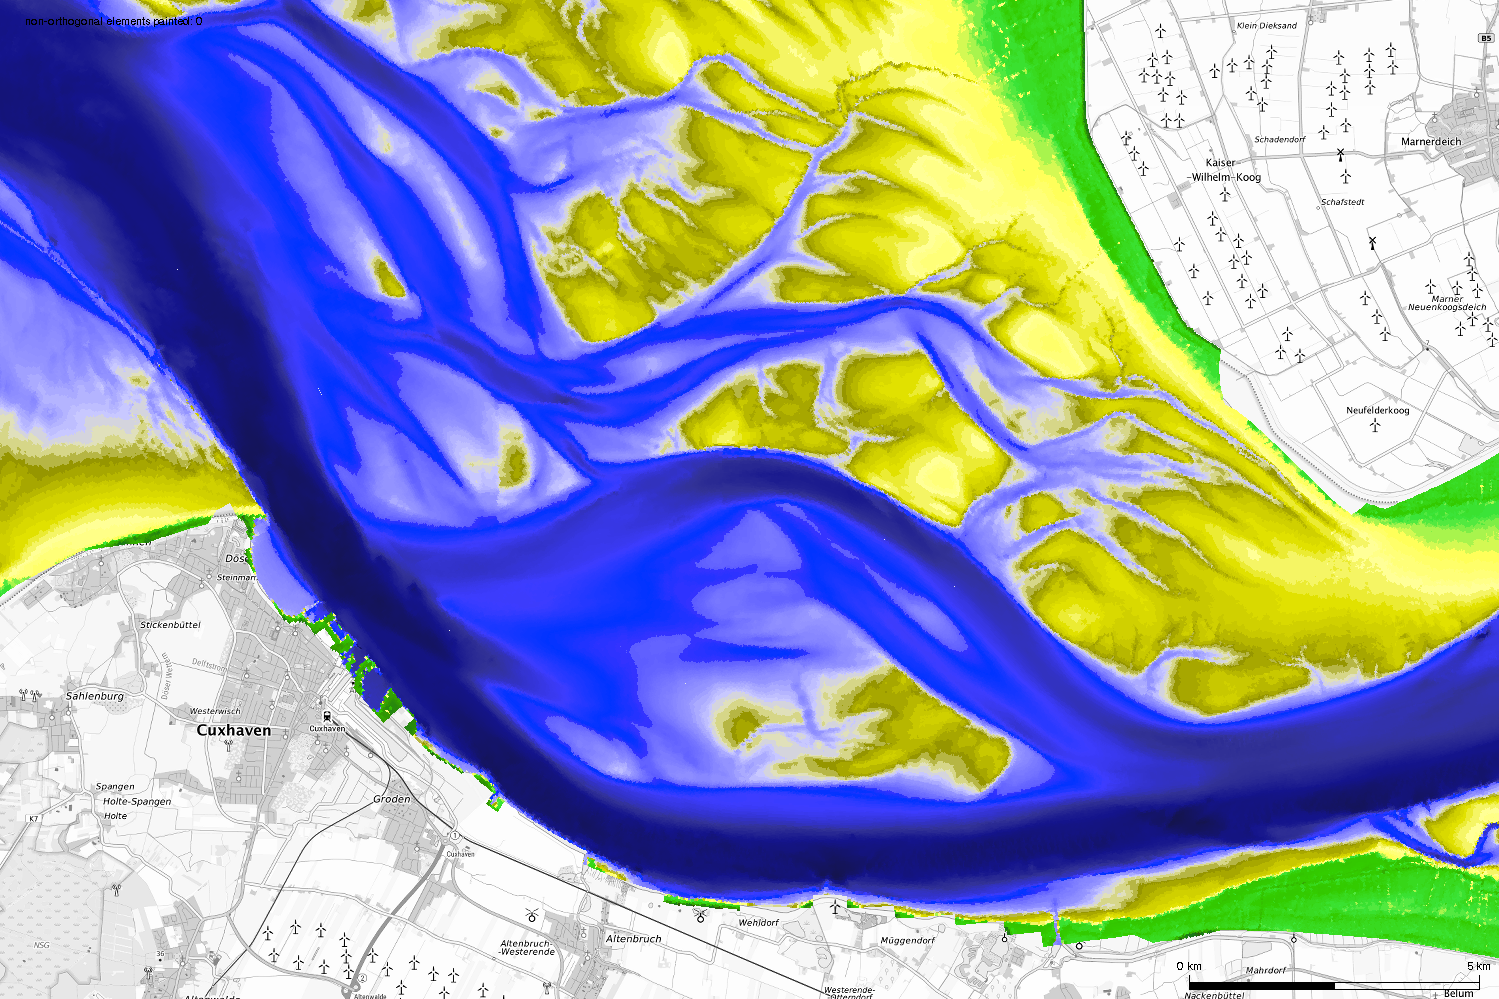
![Animation: water level for the north sea [m]](assets/Bilder/Webseite/Galerie/49_2013_Hydrodyn_NSEE_0512-0812.gif)
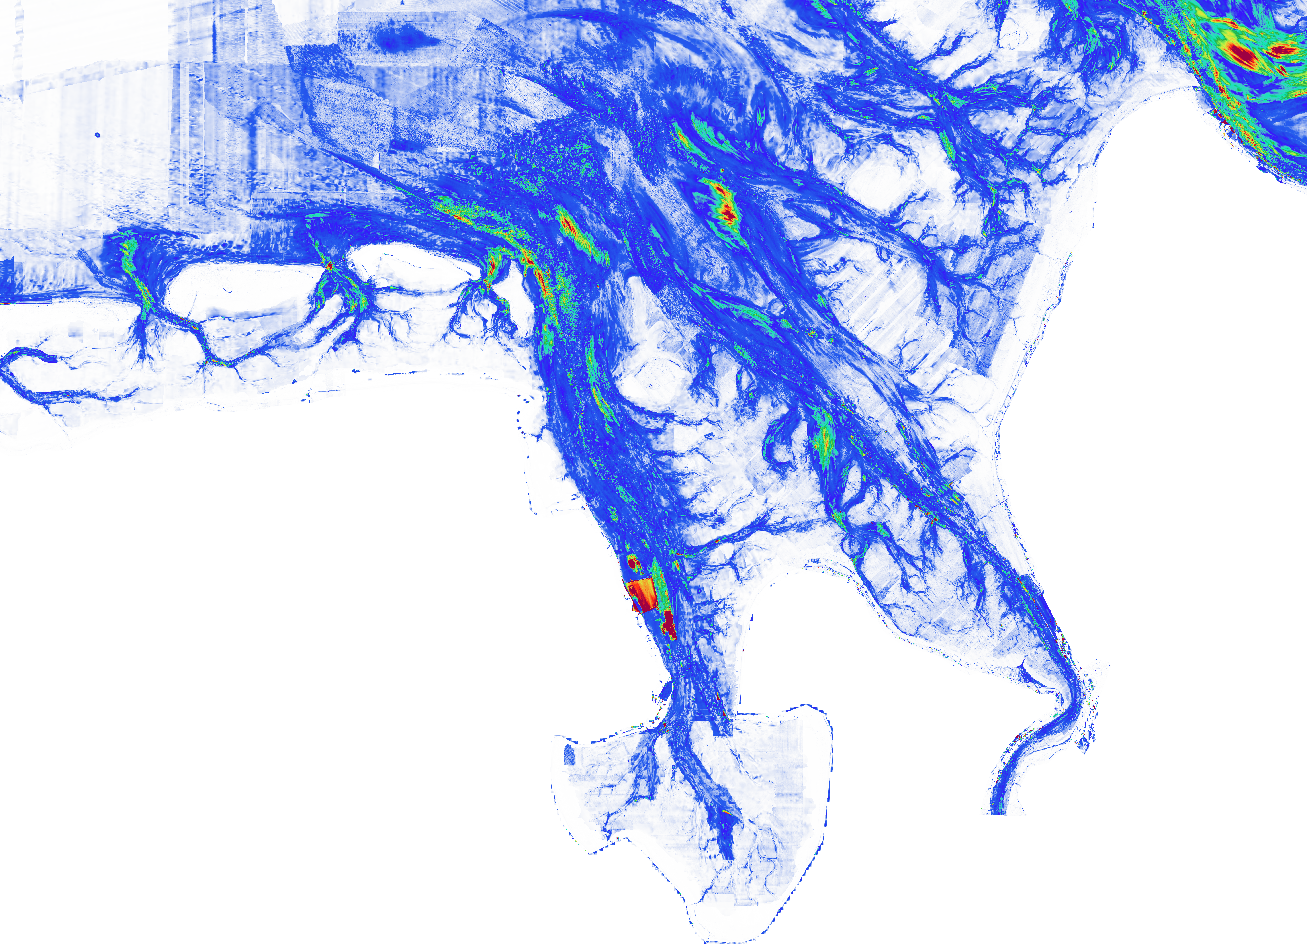
![Animation: significante wave hight [m] during storm Xaver (2013)](assets/Bilder/Webseite/Galerie/47_swh_xaver_2013.gif)